
Reports Center is a tool featured generation of network usage and user activity statistics. Each report may be adjusted by various criteria: reporting period, the number of users, type of result sorting. The intercepted data is analyzed by the program and if the data satisfied to the given criteria is detected, Reports Center adds the relevant information to the created report.
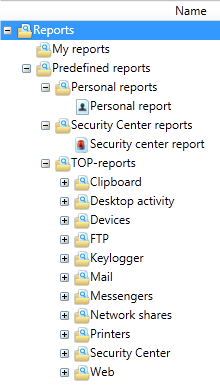
You can organize the reports into groups depending on their types. It is possible to create a report group with statistics of users web activity (visit of web resources using HTTP protocols), group for reports on activity of messengers users, etc.
Management of Reports Center structure
Four types of report can be created with Report Center tools:
- TOP-report – the report with statistical data on TOP – users activity. Employees with extremal values of report results are considered as TOP – users .
- Personal report – the report with statistical data on activity of the particular employee.
- Security center report – the report with statistical data on Security center incidents.
- Consolidated report – the report contains consolidated statistic on selected users activity parameters within specified period.
Generating report
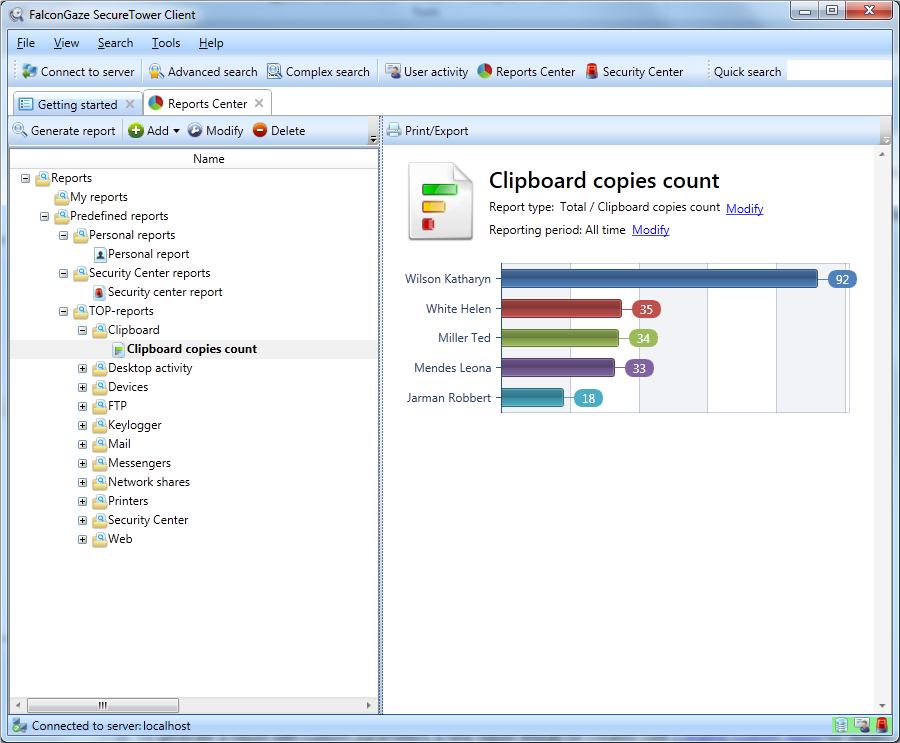
To generate a necessary report, select its name from the list in the Reports Center window. Statistic on an appropriate type of information will be displayed in the right part of the Reports Center window (report results area) in a graphic form.
Creating group of reports
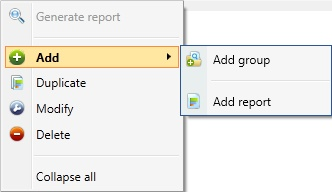
To create a new group of reports, in the Add drop-down menu of the Reports Center window ribbon toolbar click the Add group option or use group context menu alternatively.
Modifying group of reports
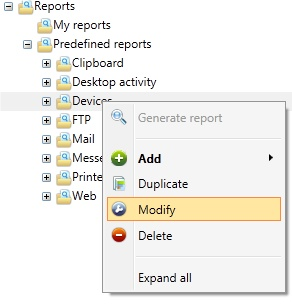
To modify a group of reports, select the necessary group and click Modify on the Reports Center ribbon toolbar or select this command in the context menu opened by rightclicking the necessary group. The group settings window can also be opened by doubleclicking the necessary group.
Deleting and duplicating group of reports
Deleting
To delete a group, select the necessary group and click Delete on the Reports Center ribbon toolbar or select this command in the context menu opened by right-clicking the necessary group.
Duplicating
To duplicate a group, select the necessary group and select Duplicate command in the context menu opened by right-clicking the necessary group.
Creating custom report
TOP report parameters
The following parameters of report are accessible for TOP report configuration:
- Users (reports can be based on the all users statistics or on the statics of the specified group of users).
- Report type (depends on type of intercepted data and statistical function type).
- Number of users (the number of top-users the TOP report result will be displayed for on the chart ).
- Type of result sorting (order of TOP report result distribution on the chart ).
- Reporting period (only data intercepted during this term will be considered in the report)
Users
To build report based on the particular user group activity, click Specified users in the Users area and make a choice. To include a particular user accounts to the list click Add user. Select the necessary user accounts from the list in the newly opened window.
Report type
More than 30 types of statistical information are available for investigation in reports. A summary statistics on investigated data types as well as an average daily statistics is available (except statistics on the start time and the end time of user activity).
Number of users
To specify a number of top-users enter the necessary number in the corresponding text box. The report will be displayed for this top-users only. The Top – users value is a number of users with the highest or the lowest quantitative value of selected report type function.
Type of result sorting
To select type of sequence for results displaying on the chart in the report result area, click the button with predefined type opposite the corresponding field and select the necessary type from the list.
Reporting period
Reports Center analyzes information, which was intercepted within specified time interval.
Personal report parameters
The following options of personal report and display filters of report results are accessible for configuring:
- Report options
- Display filters
Report options
Select a user name from the User list to generate a report for. Reports Center analyzes information, which was intercepted within specified time interval.
Display filters
The personal report can contain different types of data about user network activity, user computer activity and statistics on applications activity which were used by a particular user. To configure the way of report result displaying it is necessary to choose corresponding display filters.
Security center report
- Users selection
- Report parameters
Users selection
To build report based on activity of the particular user group, click Specified users in the Users section and make a choice . To include a particular user accounts to the list click Add user. Select the necessary user accounts from the list in the newly opened window.
Report parameters
Select the necessary reported time interval from the View by list to display a number of incidents per every day, week, month or to present a number of incidents registered for all reporting period.
Select the necessary status of incident which data should be included into the report results from the corresponding list. Select the Do not show security rules without incidents check box to include only the information on rules with registered security incident in report results.
Reports Center analyzes information, which was intercepted within specified time interval. To specify this interval, click the relevant radio button in the list of intervals or click User-defined interval and specify your own with built-in calendar tool.
Consolidated report
The report parameters and the scheduler of report notifications sending are available for Consolidated report configuring.
- Users selection
- Reporting period
- Display filters
User selection
To build report based on the particular user group activity, click Specified users in the Users section and make a choice .
To add a group of system users, click Add group and select the necessary one from the list of SecureTower users groups.
To add the AD objects, click Add AD object and select the necessary domain name and objects from the AD structure. Use filtration if necessary.
Reporting period
Reports Center analyzes information, which was intercepted within specified time interval. To specify this interval, click the relevant radio button in the list of intervals or click User-defined interval and specify your own with built-in calendar tool.
Display filters
There are a wide range of statistical data available for including into consolidated report. A summary statistics on investigated data types as well as an average daily statistics are available. The average statistics is considered on the basis of actual working days during the specified time.
Modifying report parameters
To modify a report, select the necessary group and click Modify in the Reports Center ribbon toolbar or select this command in the context menu opened by right-clicking the necessary report.
Deleting and duplicating reports
To delete a report, select the necessary report and click Delete on the Reports Center ribbon toolbar or select this command in the context menu opened with right click the necessary report.
To duplicate a report, select the necessary report and click Duplicate in the context menu opened by right-clicking the necessary report.
Updating report results
Statistics updating is performed in automatic mode at night time. After updating all the reports are built by the system without considering the followed changes of interception statistics and changes in the system. Therefore the manual statistics data updating should be performed to include the latest changes into reports results.
Viewing a report
Results of report generation are displayed in the right part of the Reports Center window in compliance with given parameters.
To view report results select the appropriate report name in the list, and click Generate report on the Reports Center window ribbon toolbar.
- Top report
- Personal report
- Security center report
- Consolidated report
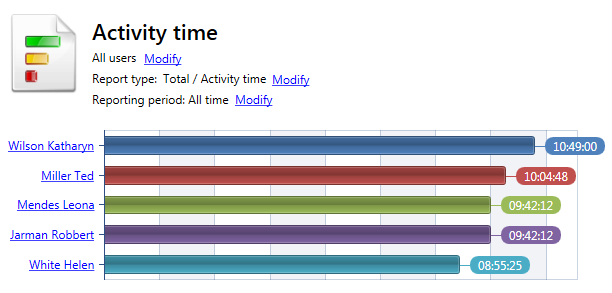
Top report
The report name, reporting period as well as results chart are displayed in the report results area.
Names of users, which intercepted data satisfied to the specified report parameters are represented in the chart.
Users name are interactive and link to the detailed data on subject of the currently report for selected user name.
Personal report
The header of personal report, statistics on user network activity, user computer activity and statistics on applications activity are displayed in the report result area.
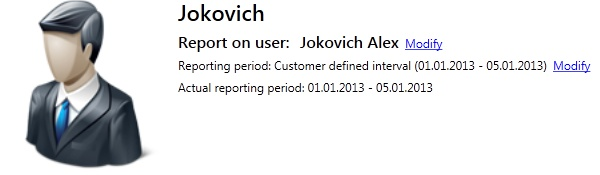
- Header of personal report
The name of the report, specified while report parameters configuring is displayed in the top of the report results area.
The name of the user, reporting period and actual period which data for report has been collected within are presented in the header.
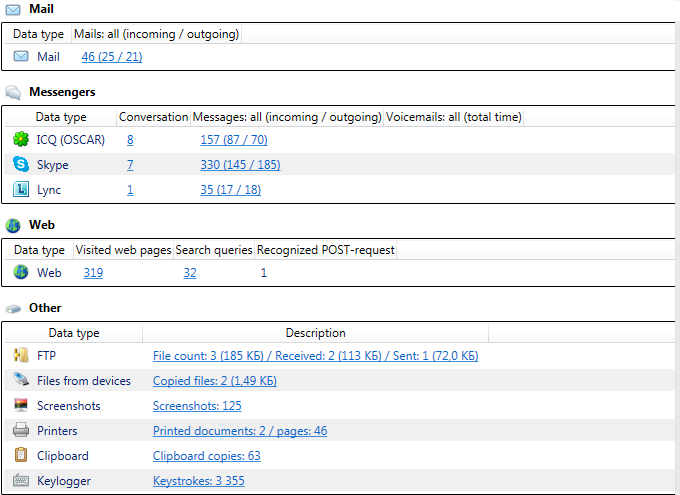
- Statistics on intercepted data
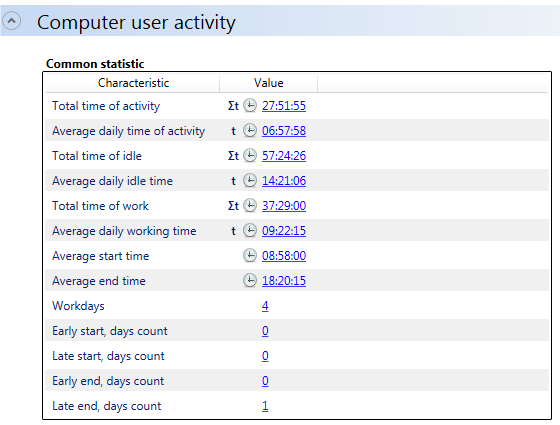
- Computer user activity
Characteristics
Statistical data on computer user activity bases on analysis of user activity pattern during the calendar day.
Start time is computed by the system as the computer first start time or the time of the first user interaction with PC, detected for a calendar day.
End time is computed as the computer latest shut down time or the time of the latest user interaction with PC, detected (in case of computer wasn’t switched off) for a calendar day.
Working time is computed as the difference between end time and start time. It should be mentioned that the user activity pattern isn’t considered while computing( for example, the idle time of the computer is considered as working time as well). The actual hours of user interaction with computer can be assessed with activity time parameters.
All calendar days with computer user activity ( for example, clipboard or mouse activity) are considered as working days. The day will not be considered as working, if a user presents at his work place but doesn’t activate his computer as well as if the computer is left activated from the previous day, but the user is absent at his work place or doesn’t interact with his computer.
Value of the Early start field complies with start time events, detected earlier than the previously specified time while display filters configuring.
Value of the Late start field complies with end time events, detected later than the previously specified time in corresponding field while display filters configuring.
Value of the Early end field complies with end time events, detected earlier than the previously specified time in corresponding field.
Value of the Late end field complies with end time events, detected later than the previously specified time while display filters configuring.
- Statistics on applications activity
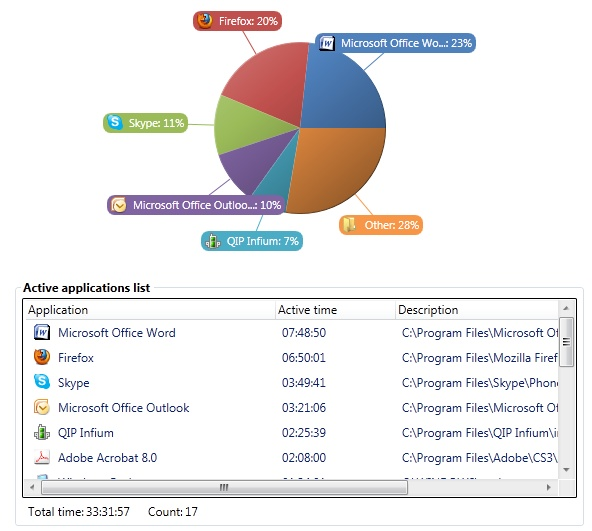
The Pie chart with list of application, which activity has been detected on user computer, are displayed in the Application activity section.
Six most active applications are usually presented on the chart as well as at the top of list. The data of applications activity in percentage (pie chart) and in hours (list) are displayed. The applications names and description for all active applications can be found in list as well.
Total time of applications activity and total amount of active application are displayed in corresponding field below the list.
- Browsers activity
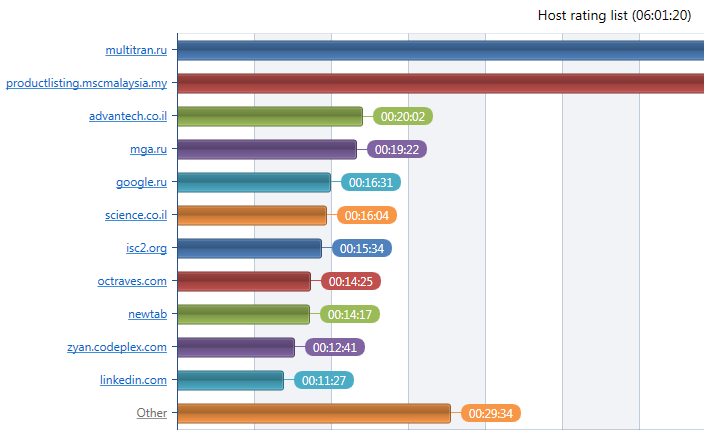
The rating of websites with the biggest session durations is displayed on the chart. The duration of visits are figured next to the each site column.
The name of the websites are performed in the link form. To view the full report on the particular site visits click the necessary site name and inspect the results in the search results window.
The list of the websites that were visited by user during specified report period is displayed in the table below the chart. Use the scrollbar to view all the records. To expand the list, click the expand arrow.
Security center report
- Report header
- Results
Report header
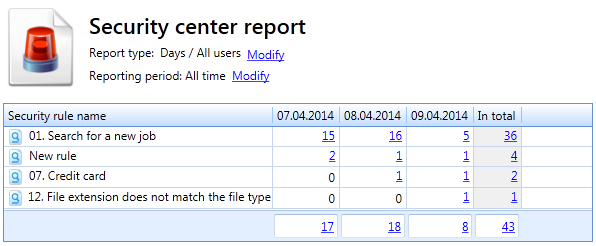
The header with report type and reporting period is displayed in the top of report result area.
While report viewing, it is possible to change the Report type and the Reporting period fields values.
To change the currently considered report type click Modify (opposite corresponding field) and select the necessary type from the list
Results
Report results are displayed in the table form. Each line corresponds to the particular security rule and contains the rule name, amount of incidents on this rule per specified time interval in corresponding cells and total number of incidents for this rule in the last column as well.
The number of all security incidents which were registered by the system during each therm and the number of all ever registered incidents are presented in the last row.
The number of incident is an interactive link to corresponding alerts in Security Center.
Consolidated report
- Report header
- Consolidated table of results
Report hader
The header with report type and reporting period is displayed in the top of report result area.
While report viewing, it is possible to change the Report type and the Reporting period fields values.
To change the currently considered report type click Modify (opposite corresponding field) and select the necessary type from the list
Consolidated table of results
The results of report generation are displayed in the table form.
The quantitative values of parameters is a link to results of interception the corresponding type of activity. To inspect the interception results click the necessary link.
The detailed information will be displayed in the search results window.